Standard Report
This report offers basic and simple reporting features. As you can see, the report is structured in segment format, facilitating easy access and reference to previous data. Each time you utilize the tool, a version of the report is automatically saved. This feature enables you to revisit and re-use the same metrics again, with the flexibility to adjust parameters such as time range or other data points to generate a new report within the same segment. By retaining these saved versions, you can efficiently manage your reporting process and save valuable time, streamlining your workflow for enhanced productivity.
How does it work?
– To begin, navigate to the report creation section and click on the ‘Create Report’ button.
– Next, fill in the required details such as the report name, select the campaign(s) from which you wish to gather data, choose the date range, and specify the desired time split for the report.
– After completing the above steps, click on the gear icon. This will display the data available for export. Note that a specific data set is already pre-selected by default. If you want to change the selection, you must deselect it first.

– Once you click on the gear icon, a pop-up window will appear with the details that you can select to extract the data.

-
General filter: The campaigns you've previously chosen will be displayed here. However, you can further refine your data extraction. For instance, you can opt to extract data from particular lines or specific creatives. Additionally, you're limited to selecting just one dimension for extraction in this scenario.
-
Chart Metrics: Within the chart metrics, you'll notice various selection options, yet the system limits you to choosing only two metrics at a time. This limitation is in place to prevent system overload. If you require more extensive data extraction, we suggest utilizing the deep data report.
-
Table columns: In this section, you have the option to choose additional data fields that will be displayed in the columns. However, please note that while you can select multiple options, the system limits you to choosing a maximum of 10 selections.
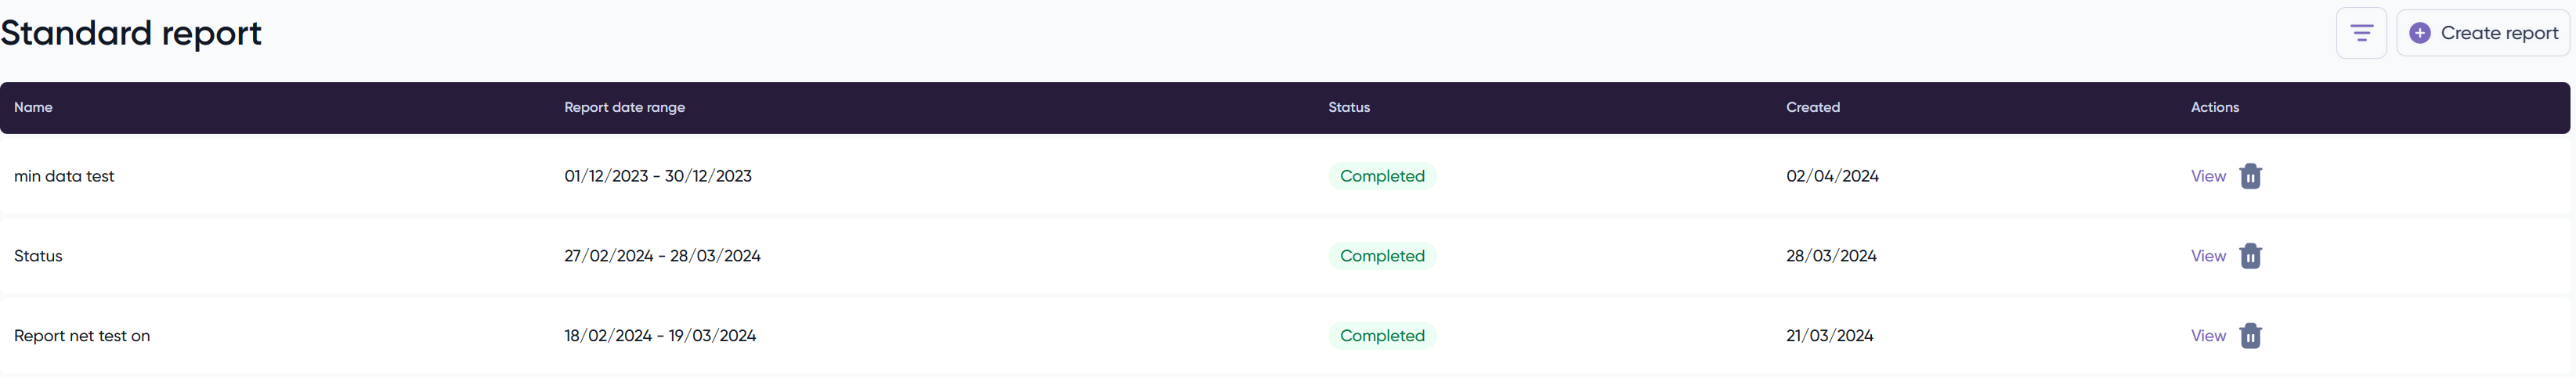
– To complete the process, simply click on the “Save” button, which will return you to the initial window. From there, all you need to do is click the “Run” button to initiate the report generation. During this process, the status will display as “Pending,” allowing you to navigate to other tabs without concern. Once the report is generated, its status will change to “Active,” enabling you to view the data. You can access the report directly within our system or download it for offline use.
To download the data, access the report, and a new button labeled “Download” will appear. Click on it, and the download will begin instantly.


